Home Assistant – Dashboard
Part 5 in this guide explained the general setup of Home Assistant and plugins used. This part explains the entire dashboard itself and all the components in it.
The following image shows my dashboard and features a heading number for every component used, which is explained in more detail further down below. My entire lovelace config is uploaded here, so you may clone it.
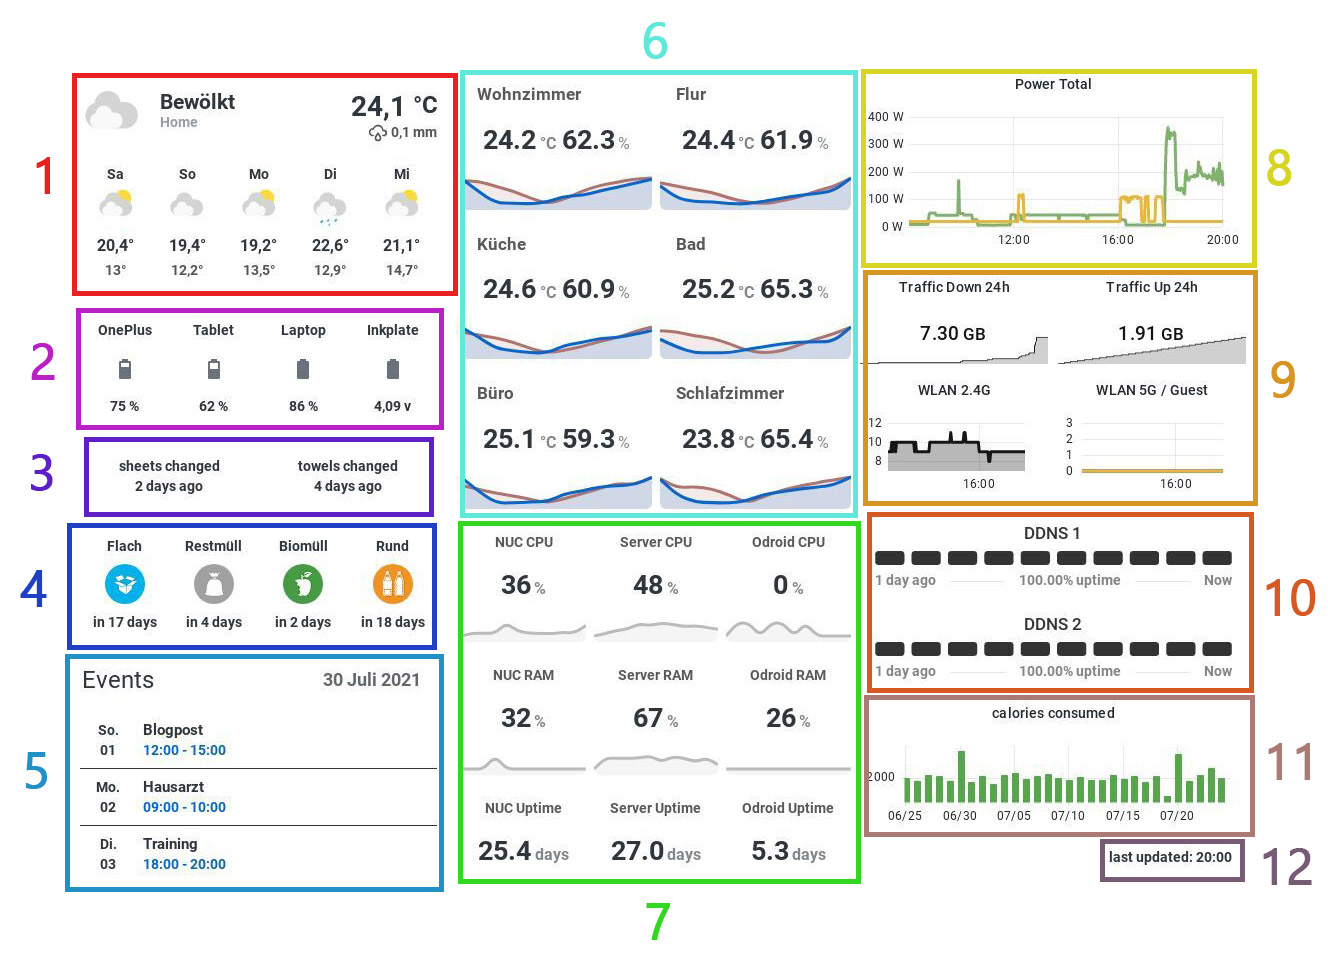
- Weather
- Battery status
- Changed indicator
- Waste collection
- Calendar events
- Temperature and humidity
- Server stats
- Power consumption
- Internet traffic and WLAN usage
- DDNS uptime
- Calorie tracker
- last updated
1. Weather
This just uses the default weather integration which is probably installed by default. The integration is called Meteorologisk institutt (Met.no). I did no further configuration except some CSS adjustments using the card mod explained in part 4.
  - type: weather-forecast
    entity: weather.home
    card_mod:
      style: |
        ha-card {
          background: none;
          box-shadow: none;
          font-weight: 700 !important;
        }
        .state {
          font-size: 1.5em !important;
        }
        ha-card > div > div > div > div.attribute {
          color: #555 !important;
        }
        ha-card > div > div > div.templow {
          color: #555 !important;
        }
2. Battery status
This is just a glance-type card with 4 entities. I’m getting the data from the smartphone and the tablet by using the official Home Assistant app. How to get the voltage of the Inkplate battery is described in part 3. For my laptop I thought a bit about my approach and then just settled on a small python script to get the reading and send it over MQTT to my broker which is then handled in the same way the Inkplate readings get handled. The python script can be found here. I’m using the windows task management (like a cronjob) to execute this script every 5 minutes. The data is then queried by an InfluxDB sensor, which is added into the configuration.yaml. I’ve written a blog post about this here. I’m using 7 days in my where clause to get the last known value in this time. If you just use a day and your device hasn’t been online for 2 days, it will show unknown. There’s probably some option to retain the last known value but I did not find a way in Home Assistant in a short search. If you know an easy way, please comment.
sensor:
  - platform: influxdb
    queries:
      - name: Zenbook-Battery
        field: battery
        where: 'time > now() - 7d'
        group_function: last
        database: sensors
        measurement: '"sensors"."autogen"."zenbook"'
...
3. Changed indicator
Because I always forget for how long my sheets and towels are in use I designed a small workflow to help me. I stuck a NFC tag beside my towels and sheets inside the closet and added these to Home Assistant. Then I’ve added two automations which are triggered by the scanning of these tags. They don’t do anything else though. In the configuration.yaml I’ve added 2 template sensors which query the last_triggered attribute of the automation and display the days. It’s not the most accurate thing and will only display 1 day ago, once it reached 24h after scanning – but it’s good enough for my use case.
sensor:
  - platform: template
    sensors:
      last_triggered_nfc_bettwaesche:
        friendly_name: "Last Trigger NFC Bettwaesche"
        entity_id: sensor.time
        value_template: "{{(as_timestamp(now()) - as_timestamp(strptime(state_attr('automation.nfc_tag_bettwaesche', 'last_triggered'), '%Y-%m-%d'))) | timestamp_custom('%d', false) | int - 1}} days ago"
...
4. Waste collection
This is a plugin I installed in HACS, the hacs_waste_collection_schedule by mampfes. If the plugin features your city you have almost no further work to do. If not, then there are ways documented to still get your schedule to show up. The images I have got from some Home Assistant forum thread, which I cannot find anymore, I hope it’s okay that I upload them into my repository here, as they were public on the forum as well. If the person who posted them is reading this: just message me the forum post and I will include you as the source in here.
The data is then made available as a sensor.
sensor:
  - platform: waste_collection_schedule
    name: Flach
    count: 4
    value_template: 'in {{value.daysTo}} days'
    types:
      - Flach
...
5. Calendar events
To display the events I’m using the atomic-calendar-revive plugin from HACS. Currently I’m experiencing some issues with it, but it looks quite nice. I hope the dev gets my issue fixed. My configuration of the atomic-calendar-revive plugin can be seen in the linked issue. You may connect your Google calendar with this plugin. I’ve switched from Google to a selfhosted Baïkal calendar. You need to use the official calendar integration to connect your calendar, so atomic-calendar-revive can use it, using the configuration.yaml like this:
calendar:
  - platform: caldav
    username: myuser
    password: mypass
    url: https://baikal.nuc.local/dav.php/calendars/myuser/default/
    verify_ssl: false
6. Temperature and humidity
For these graphs I’m using the mini-graph-card installed from HACS. The data is queried by Zigbee2Mqtt from the SONOFF sensors mentioned in part 2, Zigbee2Mqtt is explained in part 5 and part 7. My setup for one of these cards looks like this:
type: custom:mini-graph-card
name: Wohnzimmer
line_color: '#b37169'
font_size: 80
decimals: 1
align_state: center
line_width: 8
show:
  legend: false
  icon: false
entities:
  - entity: sensor.sonoff_temp_wohnzimmer_temperature
    name: Temperatur
    index: 0
    y_axis: secondary
  - entity: sensor.sonoff_temp_wohnzimmer_humidity
    name: Humidity
    show_state: true
    index: 1
card_mod:
  style: |
    ha-card {
      background: none;
      box-shadow: none;
    }
    ha-card > div > div > span {
      font-weight: 700 !important;
    }
    ha-card > div {
      font-weight: 700 !important;
    }
    ha-card > div > div.name > span.ellipsis {
      color: #000 !important;
    }
...
7. Server stats
For these graphs I’m using the mini-graph-cards from the previous paragraph as well, but I adjusted the look a little to make them better readable. There is unfortunately no way to adjust the height without losing the graph – this way I would be able to preserve some space and maybe squeeze another component in there.
I thought about an integration of this data for quite a while. The NUC is the one Home Assistant runs on (so on premise). The Server and the Odroid are on different locations and I do not want to open ports on them or the NUC, to send data to any of those devices. Because I have a Datadog agent running on every one of those machines (free up to 5 machines btw.) I used Datadog as a intermediary, because Datadog already gets the necessary data. There is no easy way to retrieve the data in the way I want over the API, so I created a little tool to do this and published a blog post about it. The tool is executed every 10 minutes to gather the data for the 3 servers from the API and calculate an average (the last value would be too inaccurate) over those 10 minutes. The data is then sent to InfluxDB. An InfluxDB sensor retrieves the data for display in Home Assistant.
sensor:
  - platform: influxdb
    queries:
      - name: NUC-CPU
        field: cpu_used_percentage
        where: "time > now() - 1d and \"host\"='NUC'"
        group_function: last
        database: datadog_metrics
        measurement: '"datadog_metrics"."one_day_only"."metrics"'
...
8. Power consumption
As described in part 1 of this guide I’m using Kasa HS110 power plugs (only 2 of them at the moment). They have been reverse engineered and can be communicated with over TCP. I am using the tplink-plug-exporter from fffonion to get the data from the plugs. I have an instance of Prometheus running which scrapes the data from the tplink-plug-exporter. A Grafana dashboard then displays the data from Prometheus. The dashboard I used can be found here. However I made a new Grafana dashboard with only the panel I want and styled it in a way that it works for the embedding. In Home Assistant this is just an iframe card with a little styling as well. In Grafana just click the dropdown on the panel you want and hit share, then copy the link. You may want to append &theme=light to the URL to change the theme. The time frame can be adjusted with a few arguments as well, see my example below.
cards:
  - type: iframe
    url: >-
      https://grafana.nuc.local/d-solo/B6fqNcYGk/power-usage-eink?orgId=1&panelId=24&from=now-12h&to=now&theme=light
    aspect_ratio: 50%
    card_mod:
      style: |
        ha-card {
          background: none;
          box-shadow: none;
        }
My first idea was to use the external Grafana renderer which just renders a panel as an image which can then be displayed in Home Assistant. However these images looked a bit blurry and the scaling was a little off, so I changed my approach to an iframe. If you’re interested in using the external renderer in a Docker environment, make sure to read my blog post about that.
9. Internet traffic and WLAN usage
The internet traffic and WLAN usage is composed of 4 more iframes which display panels from Grafana, exactly as mentioned in the previous paragraph. Because I’m stuck with a Fritzbox without SNMP (as described in part 2) I had to look for alternatives to get some data. Someone by the name Schmidsfeld created TelegrafFritzBox which uses Telegraf to query data from the Fritzbox. Unfortunately this only worked well for DSL internet contracts and since I’m using a cable one, I relied on a fork by Lexiv. I then made my own fork for a dockerized cable setup.
I also included my Grafana dashboard in that repository, which I got from a fork and customized it a bit to adjust it to my connection. Telegraf is scraping the data from the Fritzbox router and pushing the data to InfluxDB. Grafana then uses the InfluxDB to display the data. I simply created a new Grafana dashboard with the 4 panels I needed, customized them a bit and used an iframe in Home Assistant for display. To calculate the traffic I needed to play around with subqueries, which I posted a blog article on. Unfortunately it seems that the data is not very accurate from the Fritzbox and cannot be used to monitor a metered connection efficiently – but for a general overview it’s neat.
10. DDNS uptime
For monitoring my DDNS services I’m using the uptime-card by dylandoamaral, installed over HACS. The configuration is fairly simple, just put this in your configuration.yaml and edit the host to match the one you’re monitoring for uptime.
binary_sensor:
  - platform: ping
    name: ddns1
    host: example1.com
    count: 10
  - platform: ping
    name: ddns2
    host: example2.com
    count: 10
In Home Assistant my configuration for this card looks like this. This is a bit work in progress, as I’m not sure if I will keep the colors this way, as I’m thinking about how I can distinguish it better in grayscale and what colors can be displayed by the Inkplate.
  - type: custom:uptime-card
    entity: binary_sensor.ddns1
    name: DDNS 1
    hours_to_show: 24
    title_adaptive_color: true
    average_template: '[[[ return variables.uptime.toFixed(2); ]]]% uptime'
    bar:
      height: 20
      round: 5
      spacing: 10
      amount: 10
    color:
      none: '#eee'
      ko: '#eee'
      ok: '#333'
      half: '#aaa'
    show:
      status: false
      icon: false
    alignment:
      status: spaced
      header: center
    card_mod:
      style: |
        ha-card {
          background: none;
          box-shadow: none;
          border: none;
          background: #fff;
          font-weight: 700;
        }
        ha-card > .footer > div {
          color: #333 !important;
        }
11. Calorie tracker
This is a based on a little tool I developed in march. A python script retrieves my user data from fddb.info, makes some calculations and persists the daily calories consumed to a Postgres database. This database is then used in Grafana as a datasource to display the data. I plan on adding the retrieval of macronutrients in the future, as this would be a metric I’m more interested in. In Home Assistant it’s just another iframe, like the ones already discussed.
12. last updated
This is my own plugin I created for this use case. It amazed me, that this didn’t exist (or at least I couldn’t find it) because I have seen some dashboards which feature something like that. You can get it from my Github, or install it over HACS. Just search for Update Time Card in the Frontend category. The basis of this plugin is the simple-clock-card plugin by fufar, which I customized to get a non-obtrusive time display.
  - type: custom:update-time-card
    hide_seconds: true
    font_size: 1rem
    card_mod:
      style: |
        ha-card {
          font-weight: 700;
        }
Well, this is it, my configuration and all the components on my dashboard. If you’re interested in having a deeper dive have a look at the entire lovelace yaml which I uploaded here.
The next and last part of this guide will show my NUC setup featuring services used in this dashboard, like the CalDAV Baikal, Zigbee2Mqtt and of course my hass screenshotter fork to render the dashboard as an image.
Interesting
Thank you for sharing this excellent write up of creating an e-ink smart home kiosk. I particularly enjoyed the architecture diagram.
Hi very cool project. Thx a lot.
I am trying to implement it as you have described, but it is not working for me. Is there any chance that you could help me? The Quick test works and I see the 600×400 px on the inkplate. The kindle screesaver add on is installed in HA but it does not work. I get a an error:
Failed to render ProtocolError: Protocol error (Page.navigate): Cannot navigate to invalid URL
at /app/node_modules/puppeteer/lib/cjs/puppeteer/common/Connection.js:226:24
at new Promise ()
at CDPSession.send (/app/node_modules/puppeteer/lib/cjs/puppeteer/common/Connection.js:222:16)
at navigate (/app/node_modules/puppeteer/lib/cjs/puppeteer/common/FrameManager.js:148:47)
at FrameManager.navigateFrame (/app/node_modules/puppeteer/lib/cjs/puppeteer/common/FrameManager.js:131:13)
at Frame.goto (/app/node_modules/puppeteer/lib/cjs/puppeteer/common/FrameManager.js:500:41)
at Page.goto (/app/node_modules/puppeteer/lib/cjs/puppeteer/common/Page.js:1167:53)
at renderUrlToImageAsync (/app/index.js:257:16)
at process.processTicksAndRejections (node:internal/process/task_queues:95:5)
at async renderAndConvertAsync (/app/index.js:176:5) {
originalMessage: ‘Cannot navigate to invalid URL’
Converting rendered screenshot of http://192.168.168.30:8123dashboard-einktest/0?kiosk to grayscale…
}
/app/node_modules/gm/lib/command.js:301
err = new Error(‘Command failed: ‘ + stderr);
^
Error: Command failed: convert: unable to open image ‘output/cover.png.temp’: No such file or directory @ error/blob.c/OpenBlob/3569.
convert: no decode delegate for this image format `TEMP’ @ error/constitute.c/ReadImage/746.
convert: no images defined `output/cover.png’ @ error/convert.c/ConvertImageCommand/3354.
at ChildProcess.onExit (/app/node_modules/gm/lib/command.js:301:17)
at ChildProcess.emit (node:events:517:28)
at maybeClose (node:internal/child_process:1098:16)
at ChildProcess._handle.onexit (node:internal/child_process:303:5) {
code: 1,
signal: null
}
How to I set up the inkplate to display the rendered image from HA? Which values are nessary to change from your quick test?
Thx and best regards
Sebastian
Hi Sebastian,
I am not sure I understand the problem. You can display some images on the Inkplate, but not the dashboard, right? In any case I can spot an error in the link you’re trying to resolve. There is a missing slash after the port:
This is the URL from your comment:
http://192.168.168.30:8123dashboard-einktest/0?kiosk
And it should be like this:
http://192.168.168.30:8123/dashboard-einktest/0?kiosk
Make sure you can open this URL in your regular browser first, before trying to open it on the Inkplate.