
Using the External Renderer for Grafana Docker
Published Updated 5 years ago
Recently I tried to make use of the renderer function in Grafana to retrieve a graph as an image for further usage. However since Grafana 7 (I guess) they decided to not include the external image renderer anymore in the Grafana Docker image. You may install the plugin yourself, however this does not work by just passing it to Grafana as an environment variable as it does for other plugins. So you’re left with two choices: create a custom Grafana Docker image or make use of an external renderer. This article describes my approach by using the external renderer.
The plugin linked above describes a section in it’s readme with a link to the official external image renderer Github repository. Besides the readme of this repo, there is no additional information in the official Grafana docs on how to make use of the renderer. However there are some forum posts in the Grafana support boards with people discussing the issues with the renderer. A rendered image can be retrieved by passing a specific URL which begins with /render/ (after the hostname) and includes the dashboard. This however is not documented and – if you’ve never made use of the renderer – unclear on how to use it exactly.
A short overview of how it works: the renderer will be started as another Docker container. The communication between Grafana and the renderer is defined with 2 additional environment variables on the Grafana container. The first is the endpoint of the renderer image (so Grafana can send the request to render to the renderer). The second is the callback from the renderer back to Grafana, which is probably passed by Grafana on the aforementioned request. A simple docker-compose setup may look like this:
  grafana:
    image: grafana/grafana:7.3.3
    restart: always
    ports:
      - 3000:3000
    container_name: grafana
    environment:
      - TZ=Europe/Berlin
      - GF_RENDERING_SERVER_URL=http://renderer:8081/render
      - GF_RENDERING_CALLBACK_URL=http://grafana:3000/
    volumes:
      - /media/enc/docker-volumes/grafana:/var/lib/grafana
    depends_on:
      - renderer

  renderer:
    image: grafana/grafana-image-renderer:2.0.1
    container_name: grafana_renderer
    ports:
      - 8081
    environment:
      ENABLE_METRICS: 'true'
The mentioned 2 environment variables can be found in lines 9 and 10. To make use of the name resolution both containers have to be on the same docker network – which will come automatically, if you decide on using docker-compose rather than a docker run command.
If both containers are up and running you do not need to create the URL to the renderer yourself. Just click on a panel and hit share:
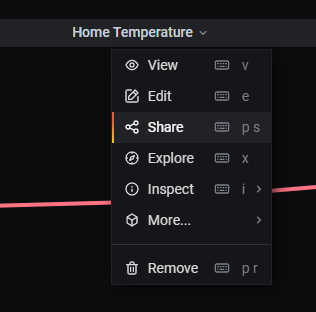
Grafana Dashboard Panel
A new popup appears with a button at the bottom to direct link the rendered image. If you click on this button a request to the renderer will be made and your browser will display the rendered image. The URL of the button click can be used by CURL or other tools as well to get a new render of the panel.
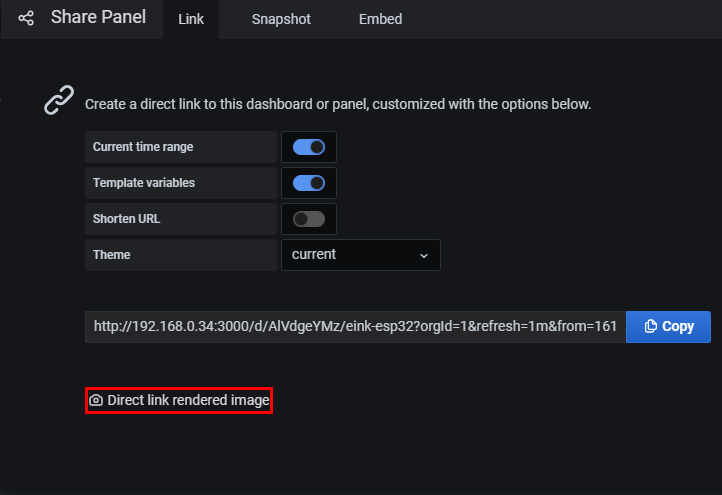
Share Panel Popup
The URL contains some options as GET parameters, e.g.:
With these options you can modify the result, by passing a width and height of the requested image or the time frame which should be included. The basis for these parameters are the dashboard settings, but in this way, they can be overwritten. To get the rendered image with another theme, just append: &theme=light
issues with reverse proxy
I am using the mentioned setup in my local network, as well as on a cloud server. The difference beeing that on the cloud server, Grafana is behind an nginx reverse proxy. There seems to be a bug with this setup, which results in the image renderer rendering the entire dashboard instead of just the requested panel. If this happens to you as well, try setting serve_from_sub_path to false: https://github.com/grafana/grafana-image-renderer/issues/201
Comments
Comments are hosted on comments.itobey.dev. Loading them sets cookies and shares your IP address with that service.