The need for a query
Some time ago I’ve decided to gather information from my FritzBox router to display in Grafana. I stumbled upon a TIG (Telegraf, InfluxDB, Grafana) stack on Github, which I forked and dockerized.
I found a Grafana dashboard to import on another fork (included in my fork as well) which is a great starting point. However it does not display everything I wanted it to. Especially the traffic (up- and downstream for an amount of time) was missing. Recently I did some digging around and found the Python script gathers also the bytes received and sent (metric name: TotalBytesReceived64 / TotalBytesSent64). This metric just goes up as its the current amount of bytes sent and received. However it can be used when subtracting the state of this metric from 24 hours ago, to get the development for the last 24 hours.
My first idea / disappointment
So my first idea was to have the query divided by 1000000 to transform bytes to megabytes. After that I figured the easiest way to achieve my goal is to have a subquery and select the last entry 24 hours ago. This entry would have to be subtracted from the query to get the amount of growth for the last 24 hours.
SELECT (mean("TotalBytesReceived64") - MY_SUB_QUERY) / 1000000 FROM "autogen"."FritzBox" WHERE $timeFilter GROUP BY time(10s) fill(null)
So I would just replace MY_SUB_QUERY with the actual query to get the last entry, something like the following.
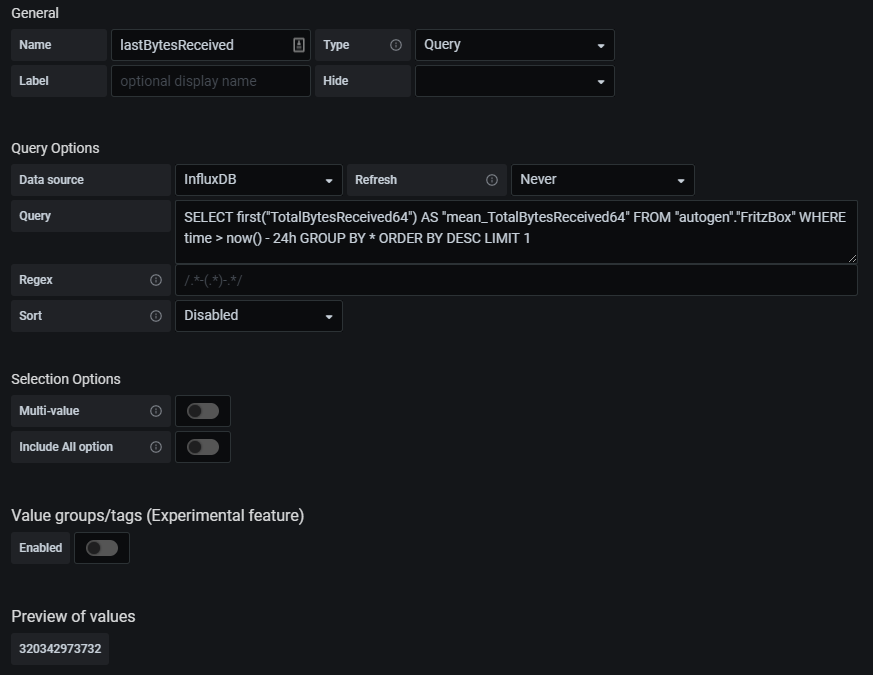
SELECT first("TotalBytesReceived64") AS "mean_TotalBytesReceived64" FROM "autogen"."FritzBox" WHERE time > now() - 24h GROUP BY * ORDER BY DESC LIMIT 1
However I soon found InfluxDB not supporting subqueries in this manner, but only in the FROM clause. I am not very knowledgeable in InfluxDB or complex subqueries for that matter, so I couldn’t think of a way to get the result I needed. Desperately clicking around Grafana finally enlightened me for a solution.
Grafana to the rescue
Grafana does not allow subqueries as well, as it just uses the query to retrieve data from InfluxDB. However it was possible (in InfluxDB as well) to have a constant instead of a subquery, which does work flawlessly.
SELECT (mean("TotalBytesReceived64") - 320342973732) / 1000000 FROM "autogen"."FritzBox" WHERE $timeFilter GROUP BY time(10s) fill(null)
This has to be updated constantly though, to have a dynamic dashboard. My first (horrible) idea was to have some kind of script execute the query to get the last entry 24 hours ago and edit the dashboard to replace the constant with the new one. When furiously clicking around Grafana I stumbled upon a feature I never used: variables. With variables you can replace constants in your query in Grafana with – well you guessed it – a variable. So the query would look like this:
SELECT (mean("TotalBytesReceived64") - $lastBytesReceived) / 1000000 FROM "autogen"."FritzBox" WHERE $timeFilter GROUP BY time(10s) fill(null)
Variables can be of different types, constant, datasource, interval – but also of type query. Defining a query variable allows to have the result of a query used in another query, exactly what I needed!
To set variables, open your dashboard settings (the gear icon on the top left on a dashboard) and choose variables. Simply enter the query and choose which datasource to apply it to. A preview will display the result – in my case: a new constant.

Refresh must be set to something other than Never, as this will only execute the query once and does not update it. On dashboard load works great for me, as I want it to refresh everytime I open the dashboard.
After setting this variable you can use the query like shown above with the variable in place. This seems like a rather simple thing, but my Google searches didn’t turn up with this idea to achieve subquery constants in a query in Grafana with InfluxDB.
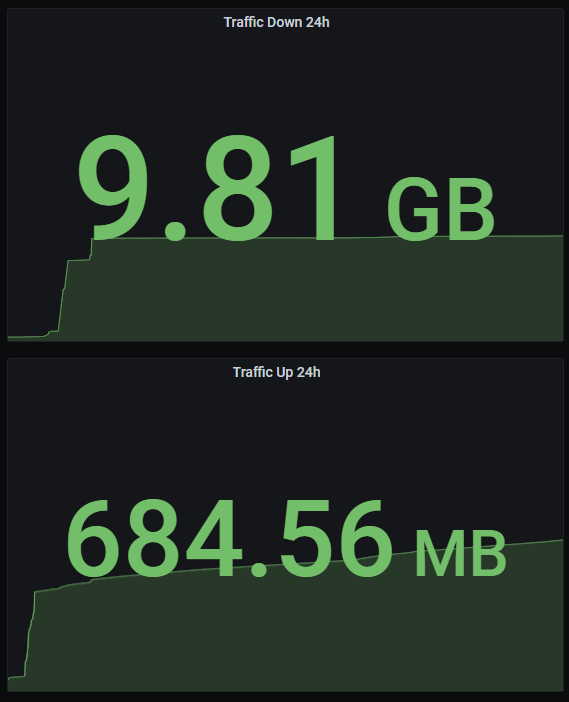
The final result looks like this. I will add this to the Grafana dashboard in the forked TelegrafFritzbox repository linked in the beginning of this article in the near future.


Exactly what I was looking for. Thank you!