Setting up the environment
During a current project I looked into HomeAssistant as a central component / hub for home automation. When starting out with HomeAssistant it is recommended to install the software either as a OS distribution (HASS OS) or run a supervised installation, which is just a couple of fancy bash scripts that orchestrate multiple docker containers.
I decided to go with neither approach, as I already have a Intel NUC running as a home server and I don’t want any third party scripts to interfere with my system and other containers. So I ran Home Assistant (core) as a dedicated docker container with the official image with a docker-compose file.
  homeassistant:
    container_name: homeassistant
    image: homeassistant/home-assistant:2021.2.1
    volumes:
      - /media/enc/docker-volumes/home-assistant/:/config
    environment:
      - TZ=Europe/Berlin
    restart: always
    network_mode: host
It’s necessary to run Home Assistant in the host network, as it needs access to devices and the network for auto discovery (if this is something you want to use).
Addons without Supervisor
When running the supervised (or HASS OS) variant of Home Assistant you will find an addon store on the web ui. This entry is missing when running the core container image of Home Assistant. This is due to a design decision, because addons are just more docker containers which are pulled and started by the supervisor (the fancy script). So there is a InfluxDB addon (in the community addon store), but this addon just starts up a InfluxDB container. It is not needed to use the integration of InfluxDB. This is not easy to understand when starting out with Home Assistant, because the documentation is not very clear about this.
Adding the InfluxDB sensor
As I already had an InfluxDB (version 1) running, into which some devices write data, I have searched for a way to pull this data into Home Assistant. My first idea was to render the graphs based in Grafana with an external renderer and display the image in Home Assistant, which works fine, but I like the design of the embedded graphs as well.
As mentioned the integration of InfluxDB works without the need for an addon. So in your configuration.yaml you do have to setup the InfluxDB integration. If you just add the integration without an exclude, Home Assistant will begin to write data into InfluxDB.
influxdb:
  host: 172.23.0.2
  verify_ssl: false
  exclude:
    entity_globs: "*"
The host IP is the IP of the running InfluxDB container. As Home Assistant runs on the host network (and my InfluxDB container does not) name resolution is not working. So it is necessary to enter the current IP of the container. To avoid having to re-enter a changing IP, when the container restarts, I will probably publish the port of InfluxDB only to localhost and enter the port with localhost in the configuration.yaml. I may publish another blog post in the future about that. The page of the InfluxDB integration has some information on how to use it as a sensor (which is what I’m doing here). However the information given there seems not to be correct or difficult to understand.
There is an example which references the property measurement in this way: measurement: '"°C"'
However measurement is documented to: Defines the measurement name in InfluxDB (the FROM clause of the query). These are entirely different things, as the example implies this is the type of data, not the name of it.
I can highly advise using Chronograf to get the working queries to add them to the sensor in the configuration.yaml of Home Assistant. In my example I queried 2 entries, one for a temperature and one for a humidity level. My sensor looks like follows.
sensor:
  - platform: influxdb
    queries:
      - name: ESP32-Temperature
        field: temperature
        where: 'time > now() - 1d'
        group_function: last
        database: sensors
        measurement: '"sensors"."autogen"."home"'
      - name: ESP32-Humidity
        field: humidity
        where: 'time > now() - 1d'
        group_function: last
        database: sensors
        measurement: '"sensors"."autogen"."home"'
With Chronograf it’s easy to see which are the parts of the query to use for the measurement, as depicted below.
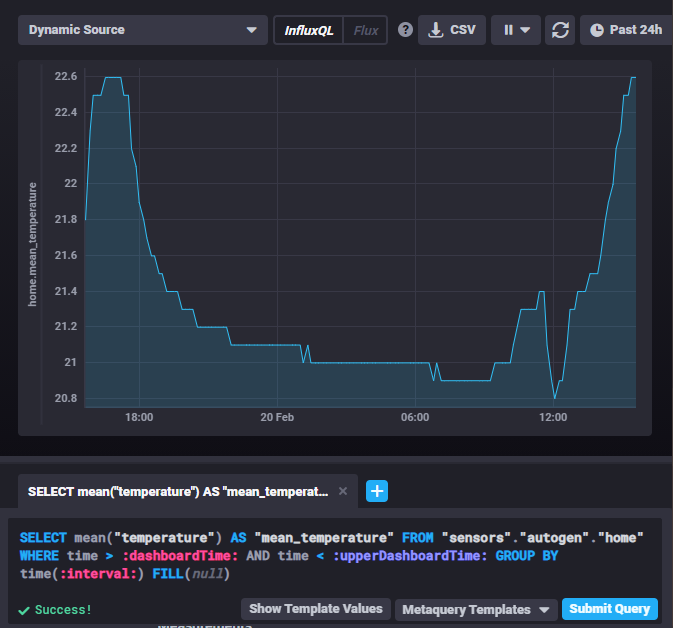
For my first try to get the data into Home Assistant I decided to use the group_function: last which always retrieves the last known entry from the result set. In this setting I imagine it’s not necessary to include a where clause (as it is not necessary when trying it out in Chronograf) but the sensor / Home Assistant will display errors, when this is not added.
After setting up the configuration.yaml you do have to restart Home Assistant for the changes to be applied. Add a new sensor and choose the entity as added in the configuration.yaml.
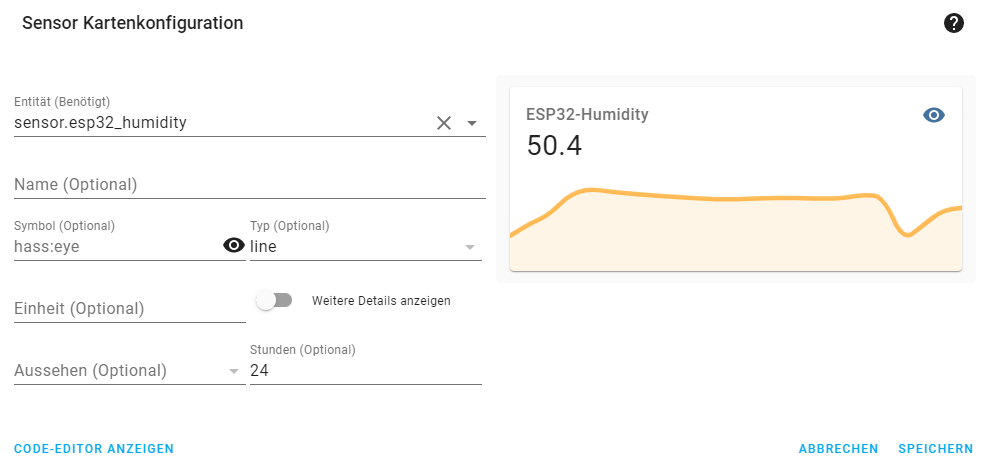
The data displayed will be just a straight line, as you only get a a single measurement (the latest) at this time. After some time you will see changes in the graph, as it has more data to display.
This approach will query only the latest data and not a specific timeframe to display it as a sensor. I’m sure this is possible as well, but in my first try I did not get it to work the way I want it to. If I decide to change it, I will update this post.

I am still struggling with this and I believe it is down to the .yaml. Can you confirm your post is exact? Most other posts I was googling have quite a few sets of “”
Yes, I’m positive this is correct as I have it working in my current setup. Feel free to post the part of your yaml and I will take a look. Maybe I can spot the issue.
Thanks for trying!
Up top:
influxdb:
host: 192.168.1.xxx
verify_ssl: false
exclude:
entity_globs: “*”
sensor:
– platform: influxdb
queries:
– name: Pump Run Time
field: Run Time
where: ‘time > now() – 1d’
group_function: last
database: Pump_Monitor
measurement: ‘”runTime”‘
Query inspector in Grafana:
SELECT “Run Time” FROM “runTime” WHERE time >= now() – 7d and time <= now()
Sorry I did not see your reply at first. I have HA on 1 pi and then influxdb on another pi I have had running for awhile. My influxdb always logs the query – but returns a 400 code instead of 200. Which I assume are just the http codes for good and bad requests. I have that exact grafana query working from node red to influx so I was thinking that it is a matter of how HA formats the query.
Hi Paul,
sorry for not getting back to you earlier.
I guess the “field: Run Time” in your query is the issue. As the value contains a space I think you may need to wrap it into double quotes, please try that:
field: “Run Time”
And you assume correctly, http return codes 2xx are success states, 4xx are client errors.
Still does not work.
` queries:
– name: SepticPumpRunTime2
field: “Run Time”
where: ‘time > now() – 1d’
group_function: last
measurement: ‘”runTime”‘
I have found a work around for this problem for now – I am able to pull the entire graphana chart into HA nicely. Thanks for the help though!
I circled back and got this working. Note how it is wrapped now by ‘ ” ” ‘.
upper section of the config.yaml:
influxdb:
exclude:
entity_globs: “*”
then lower down.
sensor:
#influx sensors
– platform: influxdb
host: 192.168.1.51
queries:
– name: test_temp
field: Temperature
where: ‘time > now() – 7d’
group_function: last
database: YardWeather
measurement: ‘”YardWeather”.”18months”.”WSReportedTemp”‘
– name: influx_sp_run_time
field: ‘”Run Time”‘
where: ‘time > now() – 7d’
group_function: last
database: Pump_Monitor
measurement: ‘”Pump_Monitor”.”autogen”.”runTime”‘
Glad you got it working now!
Hey, I’d be so glad if you could help me.
I got HA to work fine (using docker) on rpi.
On that same pi I have a running influxdb (not in docker).
Following query works:
select last(Kapazitaet) from “solaranzeige”.”autogen”.”Batterie” where time > now() – 7d
name: Batterie
time last
—- —-
1671439871000000000 83.12
I put, analog to your example, following lines into configuration.yaml:
influxdb:
# gateway from docker to host (can i verify this working ?)
host: 172.17.0.1
verify_ssl: false
exclude:
entity_globs: “*”
sensor:
– platform: influxdb
queries:
– name: influx_solar_soc
field: Kapazitaet
where: ‘time > now() – 1d’
group_function: last
database: solaranzeige
measurement: ‘”solaranzeige”.”autogen”.”Batterie”‘
Trying for days now with lot’s of variations but w/o luck.
The sensor is never listed in HA !?
So could you please check on this ?
Thank you in advance : )
Me again Got it to work.
hat to add the host ip in both parts, the inital part which excludes everything and the sensor part. now it works.
Glad you got it working 🙂
Struggling with the same issues – Are you still active with this? or related…
my sensor is Victron Cerbo/Battere state of charge (last value) and HA simply does not show anything what looks like my sensor data…
sensor:
– platform: influxdb
queries:
– name: ‘Pylontech Li-Ion – SoC’
field: ‘value’
where: ‘time > now() – 5m’
group_function: last
database: homeassistant2
measurement: ‘”homeassistant2″.”autogen”.”SOC”‘
And in Influx side:
SELECT last(“value”) AS “last_value” FROM “homeassistant2″.”autogen”.”SOC” WHERE time > :dashboardTime: AND time < :upperDashboardTime: GROUP BY time(:interval:) FILL(previous)
I suppose you can see the data in Chronograf or when querying InfluxDB? If not, please verify this works first. Secondly I only have suggestions, not sure if these things fix your issue. Try having a name of the device without blanks, like “Pylontech-SoC”. Also the field value has quotes on your part. I’m not sure if this may result in an issue, I did not use quotes here. Try updating the time to resemble a larger window, like 1h instead of 5m. Maybe even more than that if there’s some timezone issue.