Recently I tried to make use of the renderer function in Grafana to retrieve a graph as an image for further usage. However since Grafana 7 (I guess) they decided to not include the external image renderer anymore in the Grafana Docker image. You may install the plugin yourself, however this does not work by just passing it to Grafana as an environment variable as it does for other plugins. So you’re left with two choices: create a custom Grafana Docker image or make use of an external renderer. This article describes my approach by using the external renderer.
The plugin linked above describes a section in it’s readme with a link to the official external image renderer Github repository. Besides the readme of this repo, there is no additional information in the official Grafana docs on how to make use of the renderer. However there are some forum posts in the Grafana support boards with people discussing the issues with the renderer. A rendered image can be retrieved by passing a specific URL which begins with /render/ (after the hostname) and includes the dashboard. This however is not documented and – if you’ve never made use of the renderer – unclear on how to use it exactly.
A short overview of how it works: the renderer will be started as another Docker container. The communication between Grafana and the renderer is defined with 2 additional environment variables on the Grafana container. The first is the endpoint of the renderer image (so Grafana can send the request to render to the renderer). The second is the callback from the renderer back to Grafana, which is probably passed by Grafana on the aforementioned request. A simple docker-compose setup may look like this:
  grafana:
    image: grafana/grafana:7.3.3
    restart: always
    ports:
      - 3000:3000
    container_name: grafana
    environment:
      - TZ=Europe/Berlin
      - GF_RENDERING_SERVER_URL=http://renderer:8081/render
      - GF_RENDERING_CALLBACK_URL=http://grafana:3000/
    volumes:
      - /media/enc/docker-volumes/grafana:/var/lib/grafana
    depends_on:
      - renderer

  renderer:
    image: grafana/grafana-image-renderer:2.0.1
    container_name: grafana_renderer
    ports:
      - 8081
    environment:
      ENABLE_METRICS: 'true'
The mentioned 2 environment variables can be found in lines 9 and 10. To make use of the name resolution both containers have to be on the same docker network – which will come automatically, if you decide on using docker-compose rather than a docker run command.
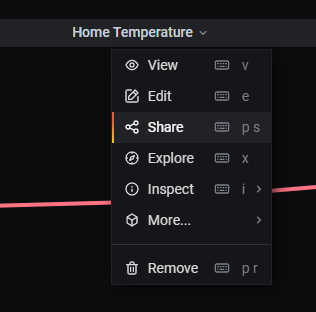
If both containers are up and running you do not need to create the URL to the renderer yourself. Just click on a panel and hit share:

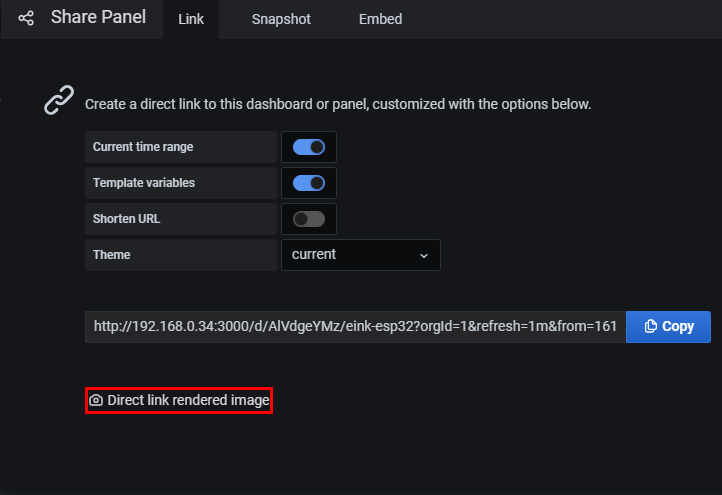
A new popup appears with a button at the bottom to direct link the rendered image. If you click on this button a request to the renderer will be made and your browser will display the rendered image. The URL of the button click can be used by CURL or other tools as well to get a new render of the panel.

The URL contains some options as GET parameters, e.g.:
http://192.168.0.34:3000/render/d-solo/AlVdgeYMz/eink-esp32?orgId=1&refresh=1m&from=1612690824644&to=1612694424644&panelId=2&width=1000&height=500&tz=Europe%2FBerlin
With these options you can modify the result, by passing a width and height of the requested image or the time frame which should be included. The basis for these parameters are the dashboard settings, but in this way, they can be overwritten. To get the rendered image with another theme, just append: &theme=light
issues with reverse proxy
I am using the mentioned setup in my local network, as well as on a cloud server. The difference beeing that on the cloud server, Grafana is behind an nginx reverse proxy. There seems to be a bug with this setup, which results in the image renderer rendering the entire dashboard instead of just the requested panel. If this happens to you as well, try setting serve_from_sub_path to false: https://github.com/grafana/grafana-image-renderer/issues/201

Thanks for this writeup. You have the top result for searches around the subject of running the renderer container next to a grafana container.
The issue I am having seems obvious, but escapes my noobie skills…..
When I start the docker container I get the following error:
ERROR: for grafana Cannot create container for service grafana: Conflict. The container name “/grafana” is already in use by container “af1f933bedeb70c42eb51dd1a2e61f3d969f5148c346bdf4c75e7f440b840c60”. You have to remove (or rename) that container to be able to reuse that name.
ERROR: Encountered errors while bringing up the project.
Perhaps I misunderstand your write up, but I want to have two docker containers on the same PC, one with my existing grafana:3000 with all its existing dashboards and another renderer:8081 and link the two so I can CURL my png rendered graphs.
Thanks for your input.
Hi, the error you’re seeing means that you tried to start another container with the name grafana, but you already have one with this name created. It’s not about which image you try to run, but the name you assign to the container. Did you run it by docker commands or by docker-compose?
If you have docker-compose, just use the one I provided in this post (and add the docker-compose header to it, of course). However you need to remove your current grafana container first (or rename the new one in the compose file, which probably will result in ‘port in use’ errors though, so you will have to map other ports there and care for any volume mounts you already have in your configuration).
You understood the post correctly, that’s what this is about. If you just want to add the renderer to the already running grafana instance, just ignore the grafana container and only use the renderer container.
Just drop me another comment, if you have further questions. Good luck!
I want to setting plugin Grafana Image Renderer but it is so difficult.
I need help and what’s better than having a video tutorial.
Thanks.
Thanks very much for the reply. You gave me some key terms to look up.
When I try and add the docker-compose header to your example (either version: ‘2’ or version: ‘3’ I get an error as follows:
ERROR: yaml.parser.ParserError: while parsing a block mapping
in “./docker-compose.yml”, line 1, column 1
expected , but found ”
Removing that header I can make some progress….
The next issue is following your advice in the very last paragraph of your reply.. I simply remove the grafana section from the docker-compose.yml since I already have a running grafana container.
Doing thus gives the following error:
ERROR: In file ‘./docker-compose.yml’, volumes must be a mapping, not an array.
Here is my docker-compose.yml
environment:
– GF_RENDERING_SERVER_URL=http://renderer:8081/render
– GF_RENDERING_CALLBACK_URL=http://grafana:3000/
volumes:
– /media/enc/docker-volumes/grafana:/var/lib/grafana
renderer:
image: grafana/grafana-image-renderer:2.0.1
container_name: grafana_renderer
ports:
– 8081
Thanks for your help, I feel I am actually making progress.
The first error is probably due to formatting issues. You NEED the header and the correct identation. I recommend you check out the docs for compose and read some intro how it works: https://docs.docker.com/compose/
And your second error is due to formatting (an invalidity) as well. You mixed up the grafana and renderer entries. You only need line 16-22 (and the header in front of that, everything above that belongs to grafana).
If you could post the statement you used for starting the Grafana container, it would be most helpful. As mentioned earlier, if you mix your regular docker run command with compose, those containers will be on seperate docker networks per default and you need to account for that, by joining them into a common network. Either this or you need to `docker inspect {containerid}` your running container and use the IP as the hostname. However the IP may change when the container is restarted, so I don’t recommend this approach.
Thanks so much for your kind assistance. Never would have got it working without your help.
I spent around 4.5 hours trying to get the renderer container to be in/on the same network as the existing Grafana container network. Won’t bore your readers with the details, but it just never got beyond ‘Can not connect’.
The light came on at some stage, and I realized that I just needed to splice the renderer into my existing Grafana container, not create a whole new one.
Once that light came on, it took about 30 minutes to get it going.
The key is to remove the ‘=’ and use the actual IP address of the PC for these two lines:
GF_RENDERING_SERVER_URL: http://192.168.1.65:8081/render
GF_RENDERING_CALLBACK_URL: http://192.168.1.65:3000/
And then put the port/network section in like thus:
renderer:
image: grafana/grafana-image-renderer:2.0.1
container_name: grafana_renderer
networks:
wxflowaio: null
ports:
– protocol: tcp
published: 8081
target: 8081
restart: always
Note, my existing network name (wxflowaio) will be different from yours.
Regarding the indent, it seems that most people just assume you know the rules of ‘docker indenting’, very little is said about it, the key there the fact that its a YAML file.
This site was invaluable for the first few hours: http://yaml-online-parser.appspot.com/
Regarding the header, you don’t actually need it at all. If you get it wrong, you get a helpful message back in the terminal like thus: ” omit the `version` key and place your service definitions at the root of the file to use version 1.”
I ended up doing this because no matter what version I used, it would not be accepted.
All that said, I am still struggling to accomplish my end goal because the renderer takes around 37 seconds to render each graph. I am now struggling to get my ‘image getter’ code to wait that long.
Thanks again for your help.
I’m confused on the issues you’re describing and what you did, but I am glad that it works for you now.
37 seconds does seem an awful lot though. Maybe your hardware is too slow, are you running on a raspberry pi or something like that? For me it takes about 5 seconds I guess, running on a NUC with an Pentium J5005. In any case, I’m happy this was helpful to you!
Thanks! As you noted, no official information at all on how to do this from Grafana. The one thing I cant seem to find is how to pass the dashboard and panel to the renderer so it knows what to render an image for? My team has Grafana Enterprise and I may be running the renderer as another image concurrently. I have the config.json, but cannot find an example of what dashboard and panel to pass it.
I can use direct URLs generated from the “Share” option. If I know what dashboards and panels I want (lets say I have a list of dashboards/panels), should I just do a cURL on the image, save the result in a file, and use the file or a link to it? Do I even need the renderer if we have the Grafana Image Renderer plugin already added?